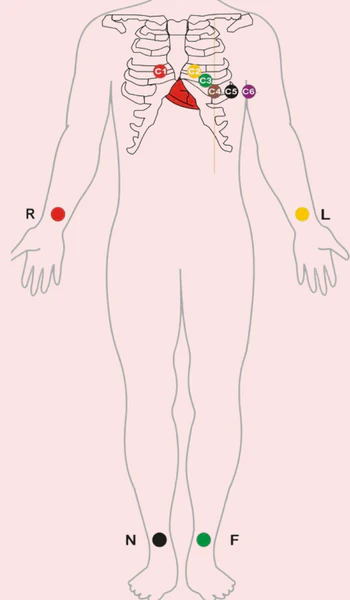
Lead Placement
| Lead | Position | Heart territory |
|---|---|---|
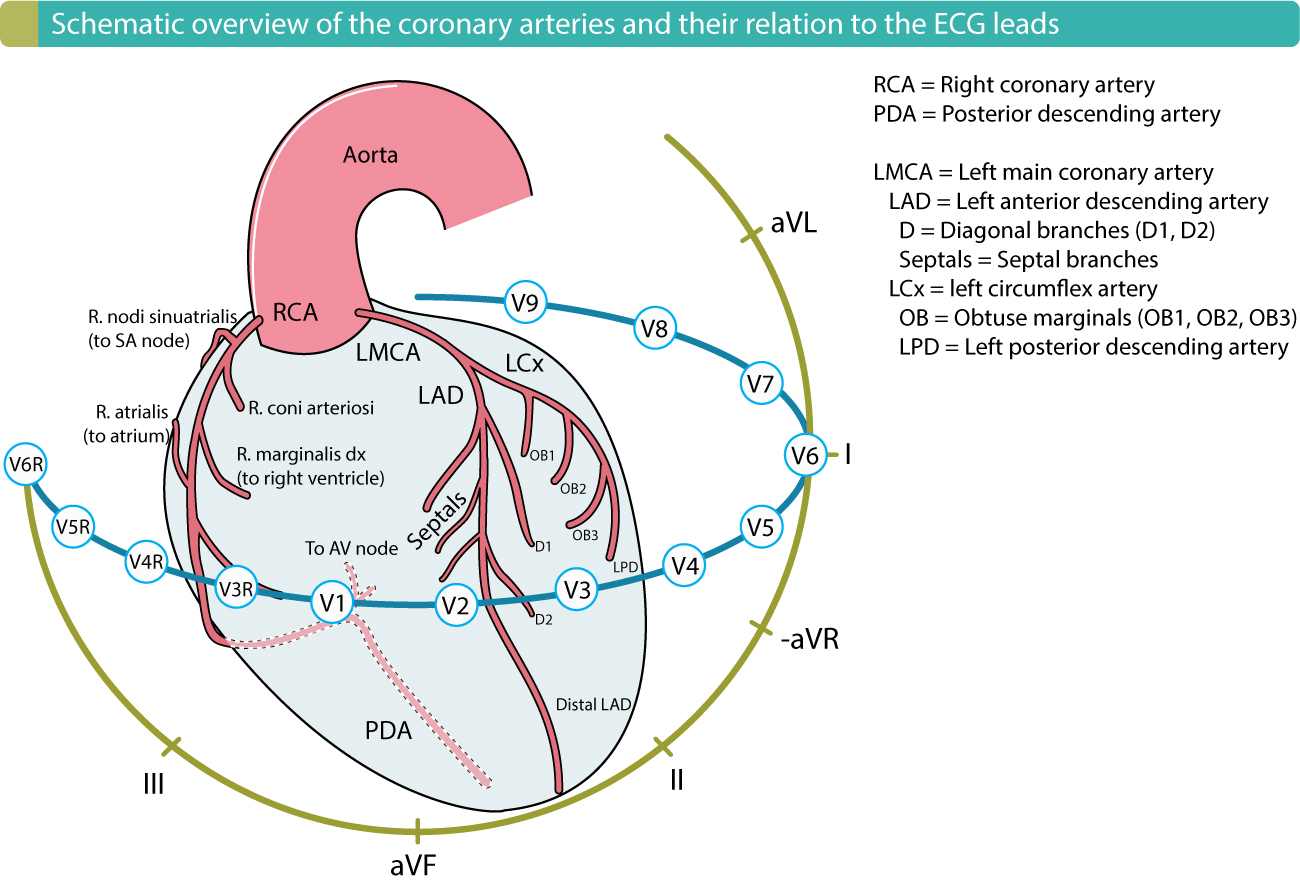
| V1 | Right 4th intercostal space | Anterioseptal |
| V2 | Left 4th intercostal space | Anterioseptal |
| V4 | 5th intercostal space mid-clavicular line | Lateral |
| V3 | Midway between V2 and V4 | Anterioseptal |
| V6 | Left mid-axillary line | Lateral |
| V5 | Midway between V4 and V6 at level of V4 | Lateral |
| Limb leads | Bony prominence on each limb (ulnar styloid process/medial malleolus) |
Interpretation
1. Confirm details
- Patient details
- When was the ECG taken
- Confirm speed and calibration of paper (25mm/s 10mm/mV)
- Any other ECGs to compare to?
2. Interpret the ECG
Assess the rhythm and rate
-
Measure the rate and determine if normal, tachycardic or bradycardic
- max sinus rate 220 - age
- A rate of 140-150 suggests possibility of atrial flutter with 2:1 AV block
- 300/number of big squares = heart rate
- 5 squares = 1 second
-
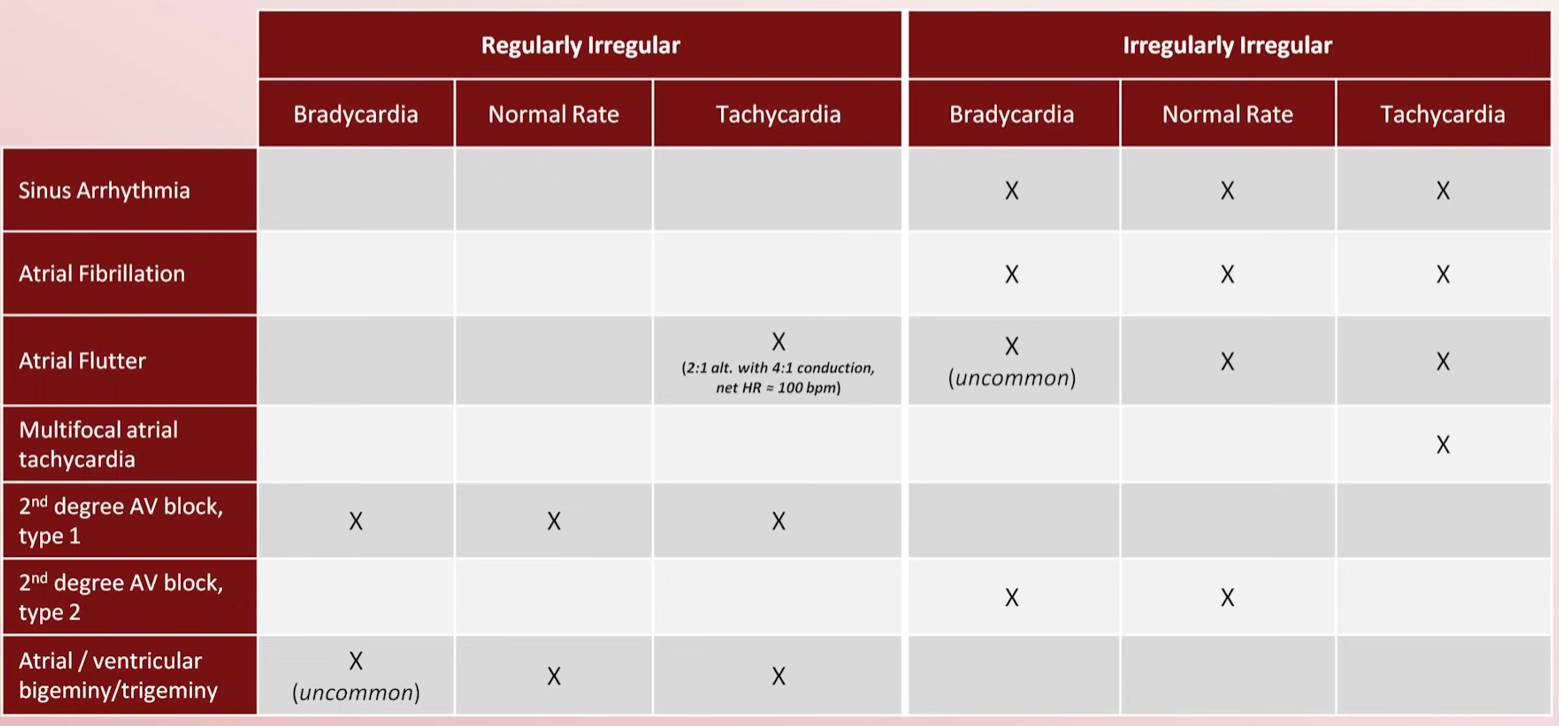
Determine if rhythm is regular, regularly irregular, or irregularly irregular (R-R interval)
-
Determine if QRS complex is narrow (normal, <120 ms) or wide ( 120 ms)
- Common causes of wide complex: bundle branch block, ventricular origin of rhythm, pacemaker, (LVH)
-
Evaluate atrial activity
- Are there P waves - what is their morphology?
- Sinus P waves should be up in I and down in aVR
- If there are no P waves are there fibrillation or flutter waves?
- Are there P waves - what is their morphology?
-
Identify relationship between atrial & ventricular activity
- Normal PR interval: 120-200ms
- Does the PR interval change?
- Correspondence between P waves and QRS
Assess the QRS axis and morphology
- Determine QRS axis
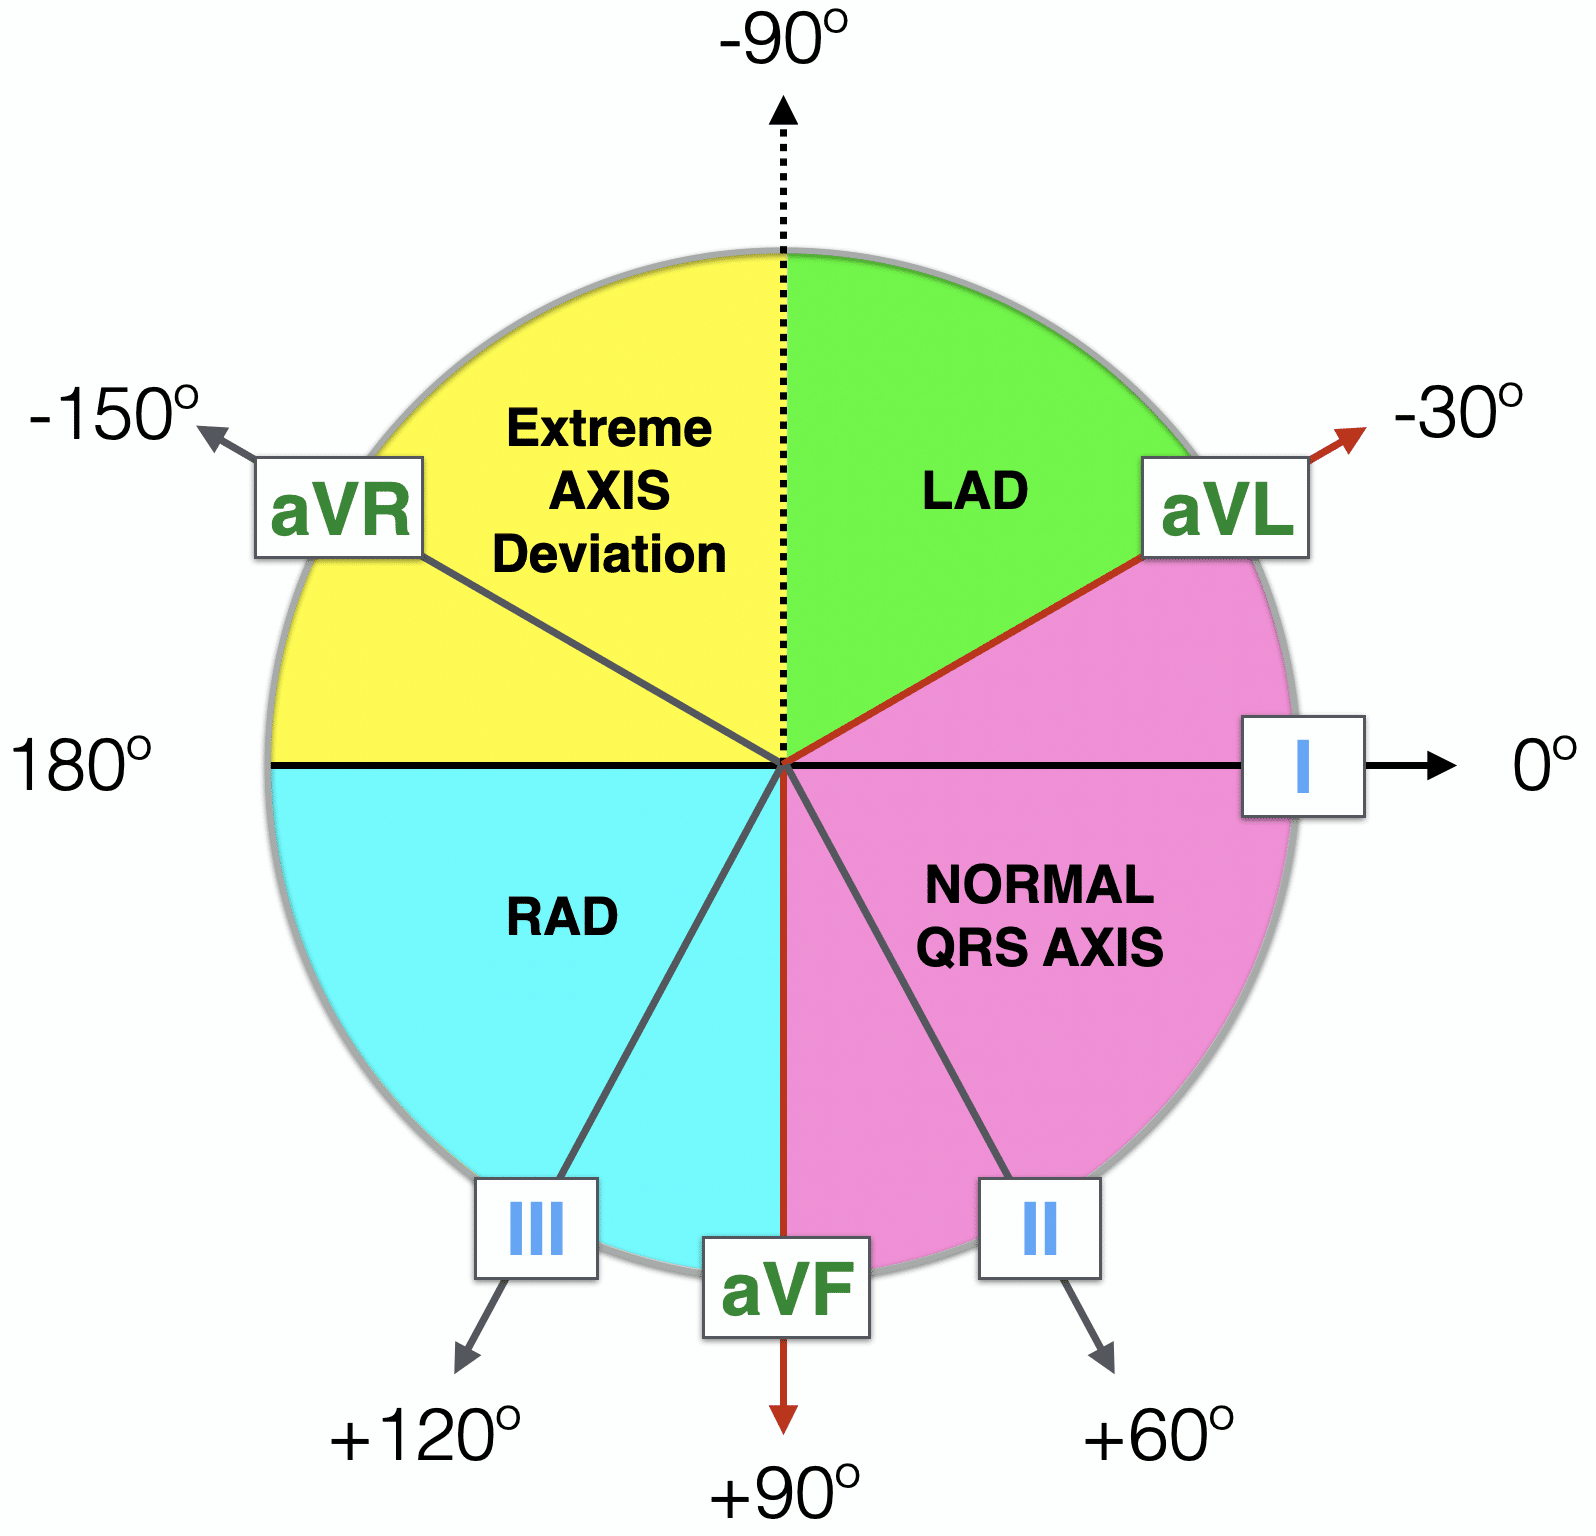
| Lead I | aVF | Axis | Deviation | Etiologies |
|---|---|---|---|---|
| Between +90 and 0 | Normal | |||
| Between +180 and +90 | Right axis deviation | Normal in children & young adults, RVH, COPD, lateral wall MI | ||
| Between 0 and -90 | Left axis deviation OR NORMAL | Normal in older obese adults, LVH, elevated diaphragm, inferior wall MI, ectopic ventricular rhythm | ||
| Between -90 and -150 | Extreme axis deviation | RVH, acute right ventricular strain, lateral STEMI, COPD, Hyperkalaemia, dextrocardia |
To determine whether it is true left axis deviation look at lead II and it will be
- Examine QRS morphology
- Pathologic Q waves - usually due to prior MI
- RVH and LVH
- If the QRS is wide identify whether the cause is left or right Bundle Branch Block (WiLLiaM MaRRoW) or just delayed
- Look for low voltage - Obesity, COPD, Pleural Effusion, pericardial effusion, infiltration, Hypothyroidism
- Look for electrical alternans which indicates large pericardial effusion
- Look for delta waves - indicates accessory pathway
Assess ST segments, T waves and QT interval
-
Examine the ST segments
- 1mm in at least 2 anatomically continuous leads
- ST elevation: STEMI, LBBB, LVH, early repolarization, Pericarditis, vasospasm
- ST Depression: Ischaemia/infarction, tachycardia, Digoxin, hypokalaemia, secondary repolarization abnormality
-
Examine the T waves
- Inverted T waves same as ST Depression + intracranial haemorrhage, later stage Pericarditis and Hypothyroidism
- Peaked T waves suggest Hyperkalaemia or hyperacute MI
-
Measure QT interval and correct for HR (should be <1/2 RR interval)
- Prolonged QT: medications, long QT syndrome, Hypocalcaemia, Hypothyroidism, hypothermia
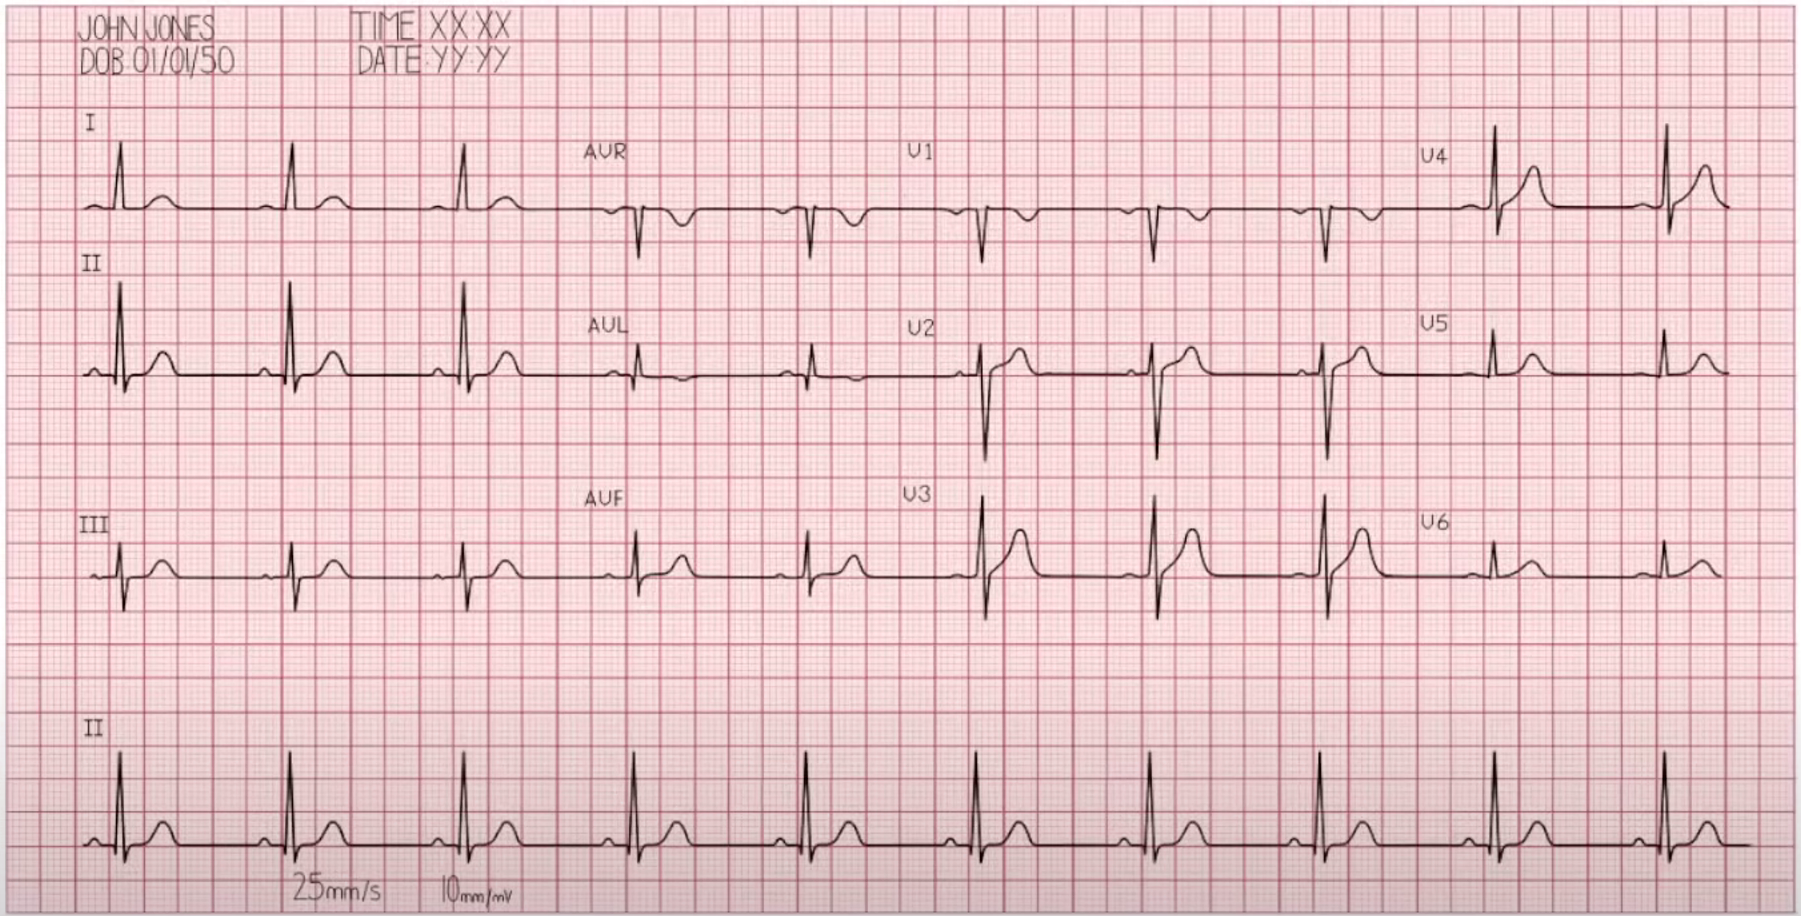
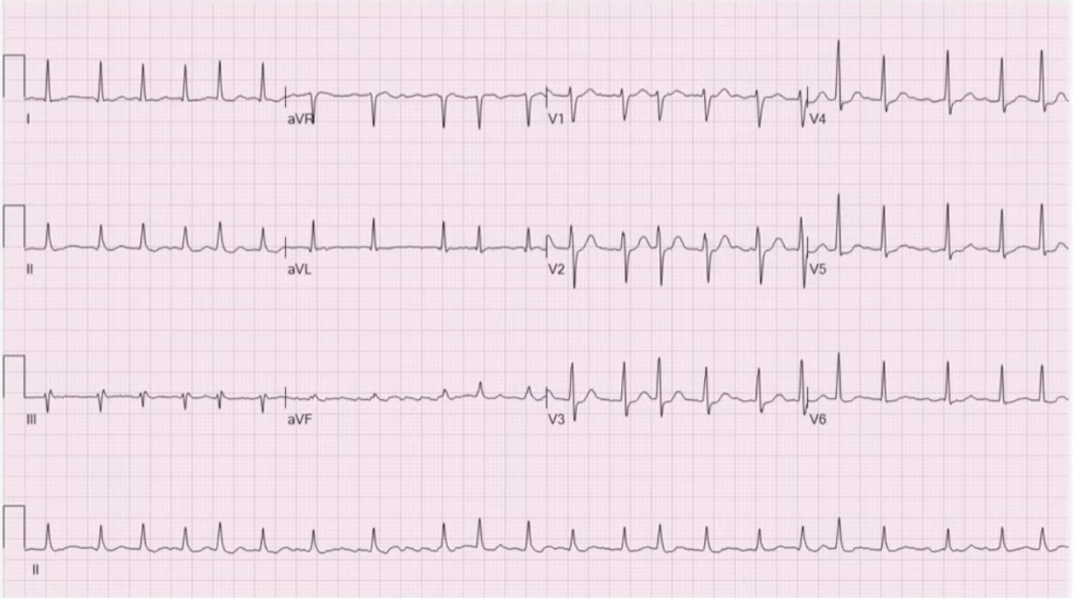
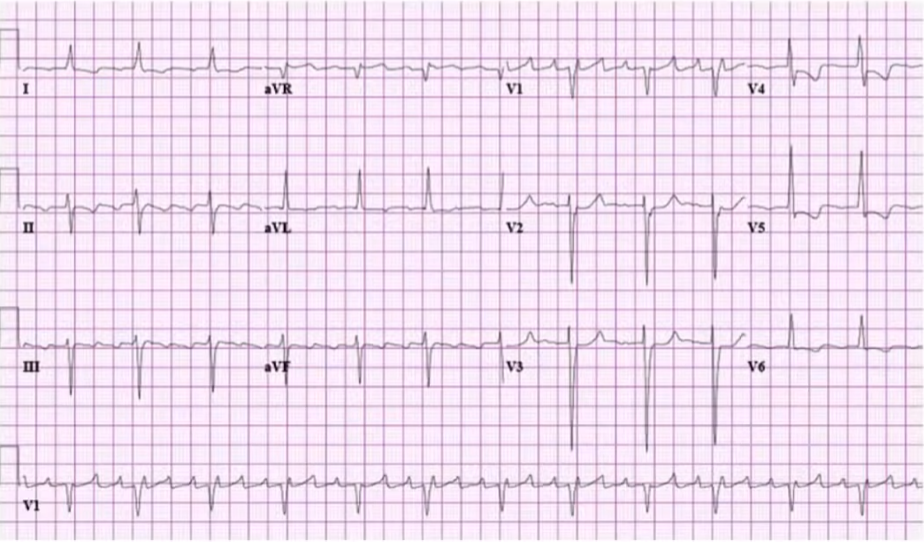
Examples
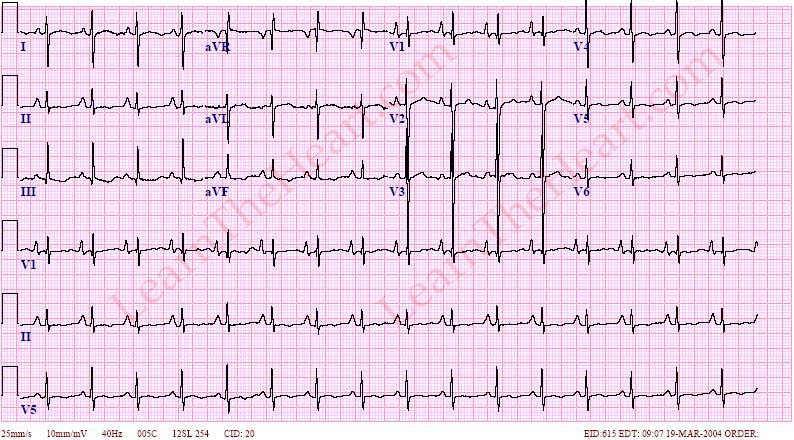
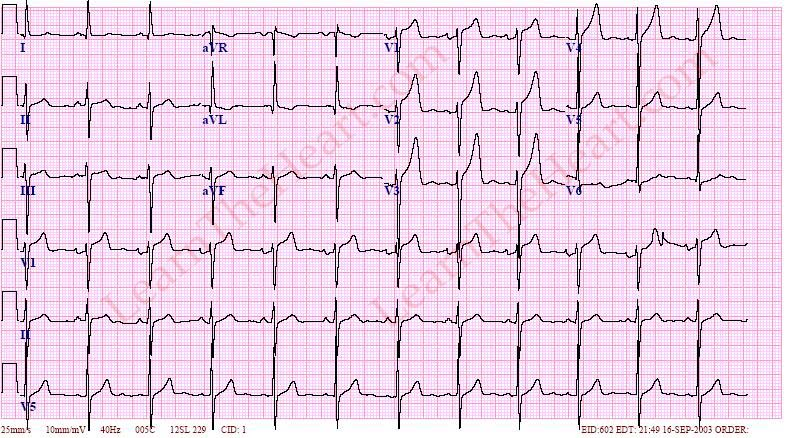
Sinus rhythm
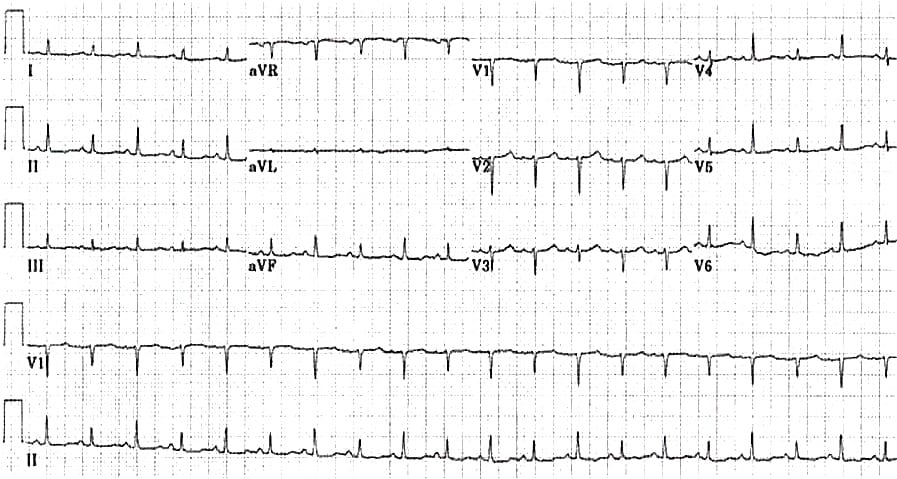
Atrial Fibrillation
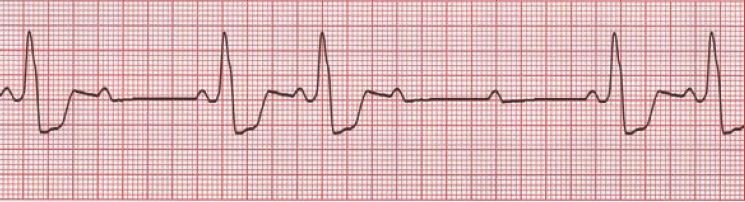
Atrial Flutter
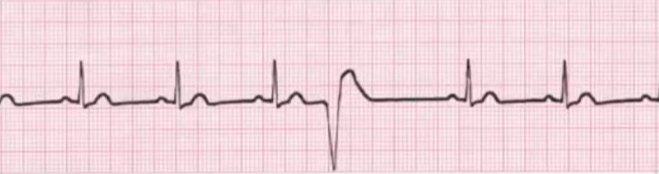
Premature Ventricular Contractions
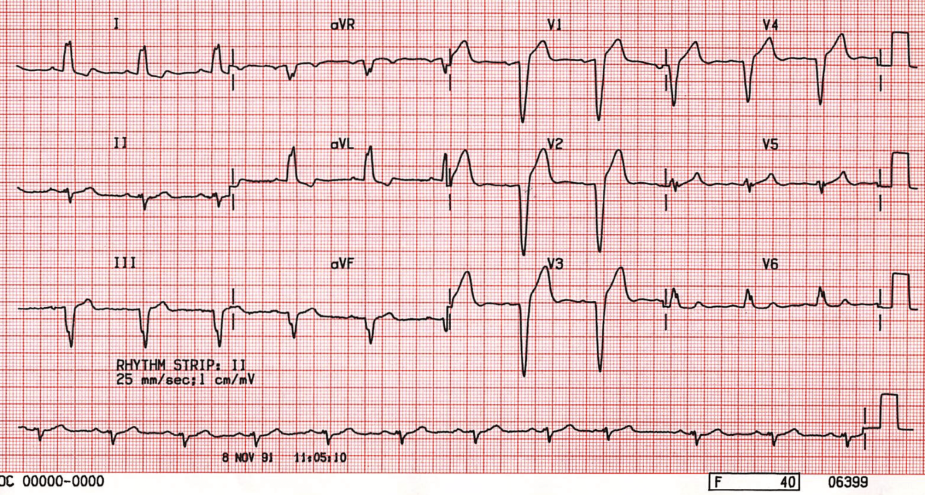
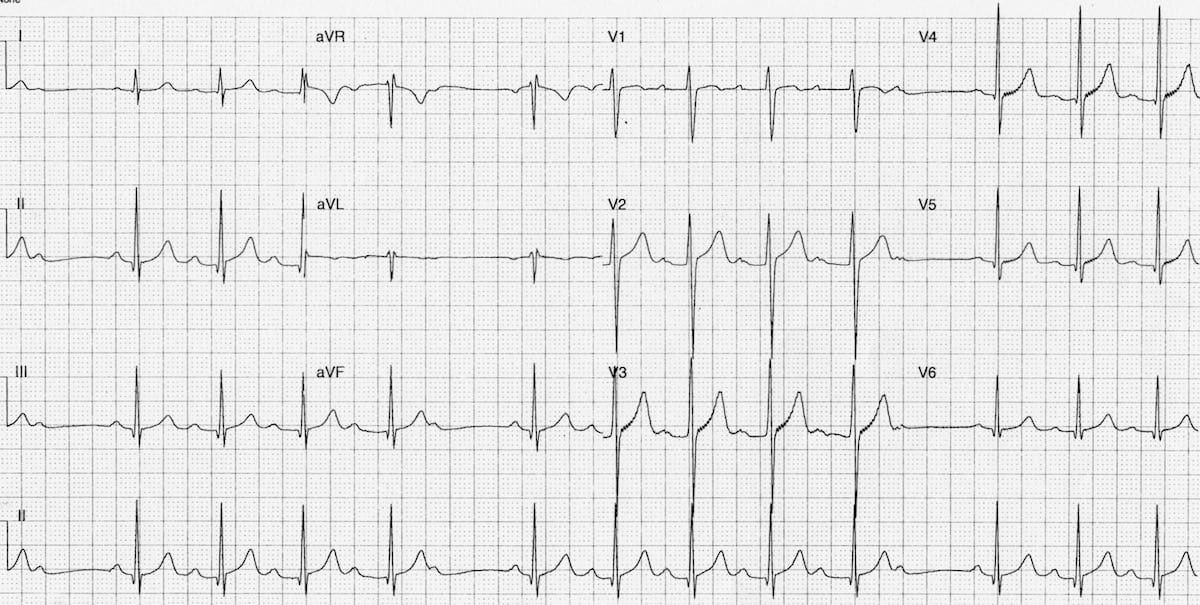
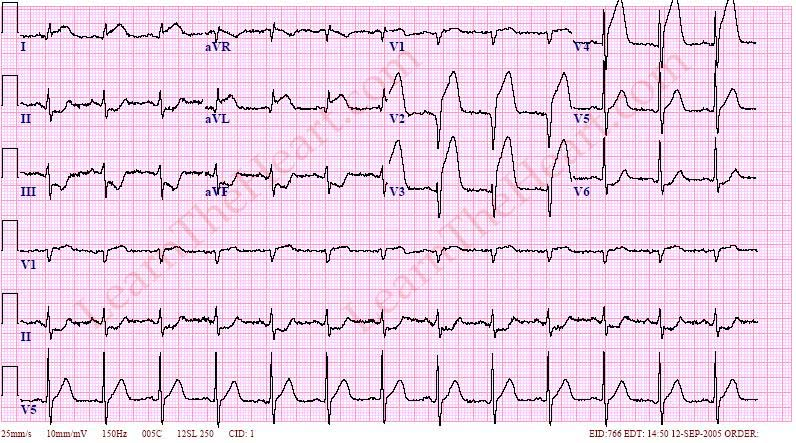
Left Bundle Branch Block
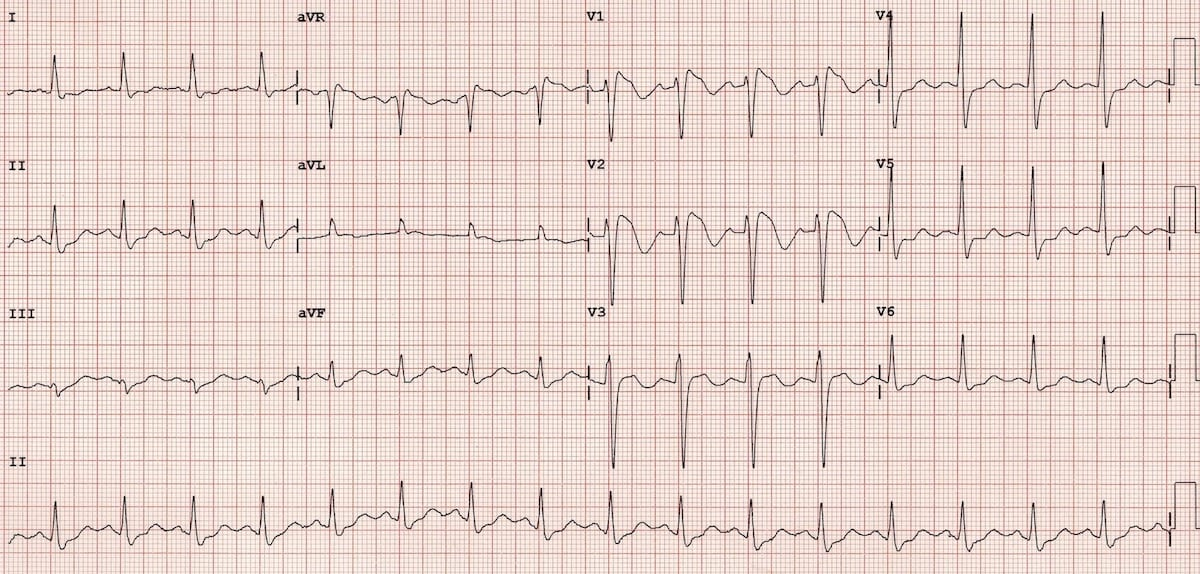
Right Bundle Branch Block
1st Degree AV Block
2nd Degree AV Block
Mobitz 1
Mobitz 2
2:1 block
3rd Degree AV Block
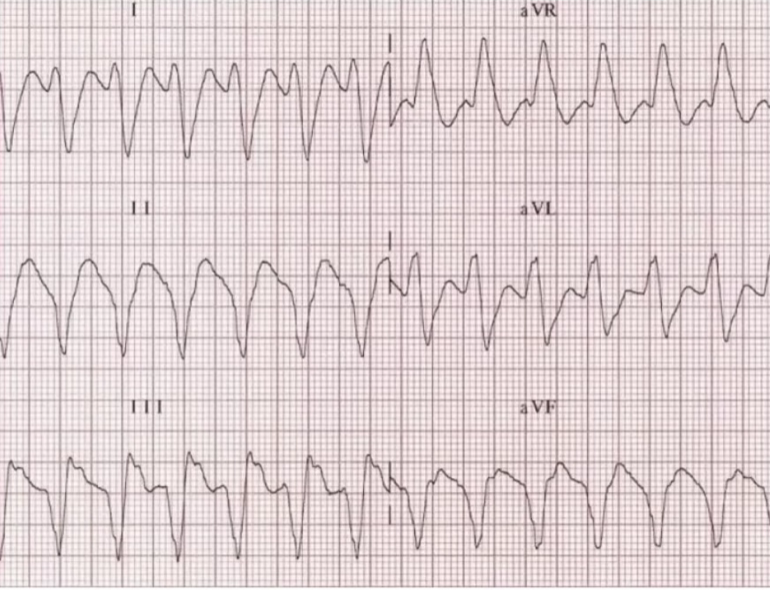
Ventricular tachycardia
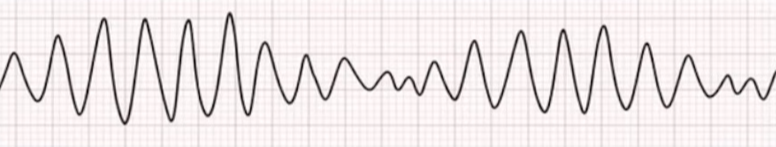
Torsades de pointes
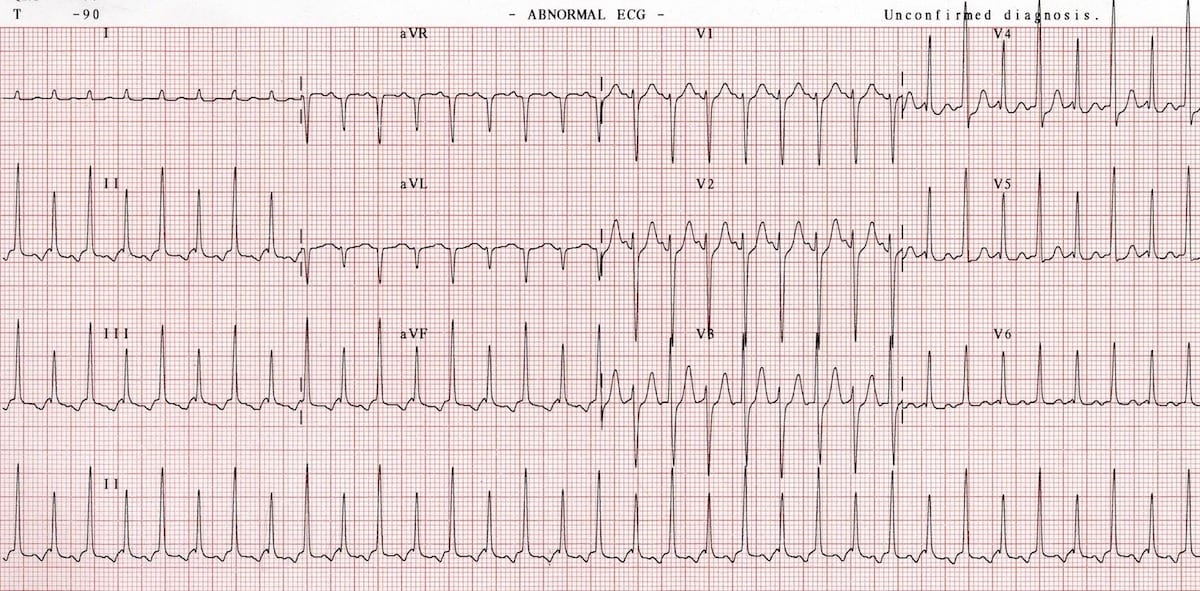
Supraventricular tachycardia (SVT)
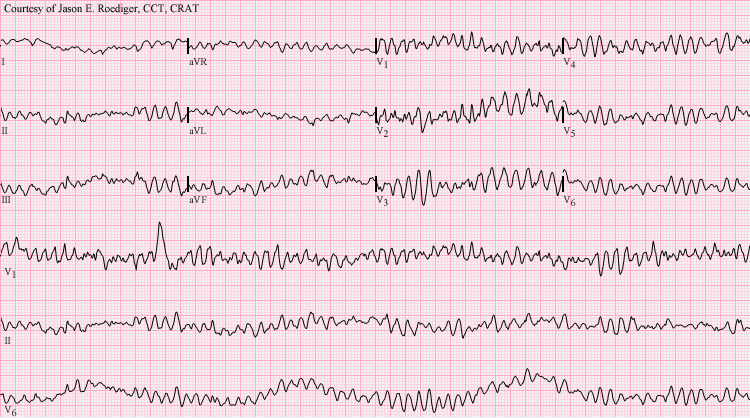
Ventricular Fibrillation
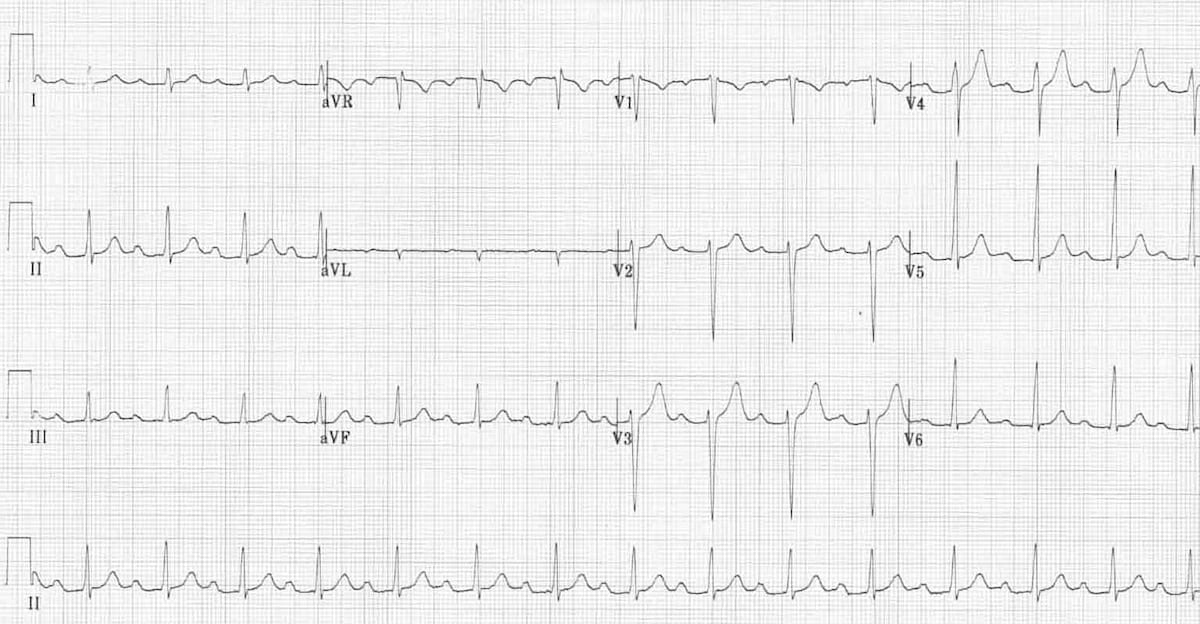
Anterior STEMI
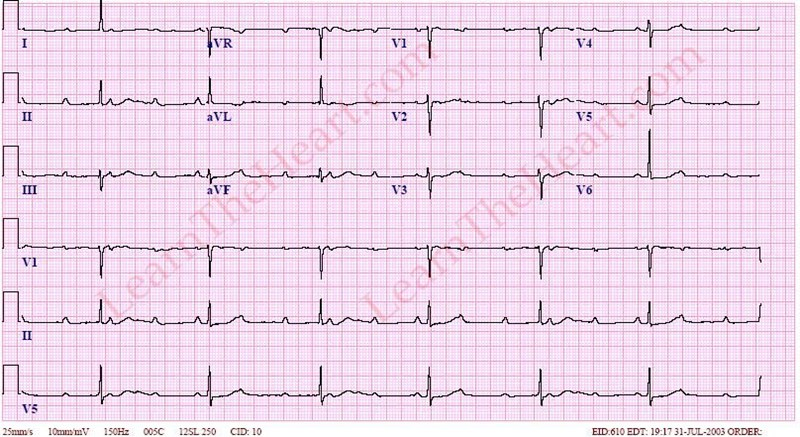
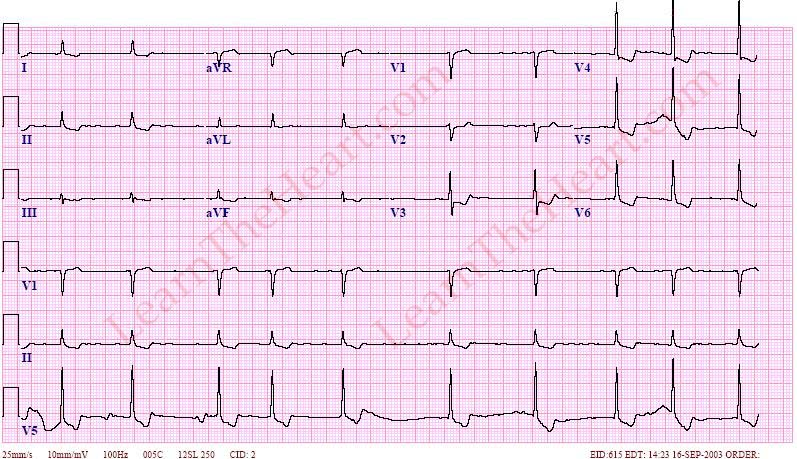
Massive pericardial effusion
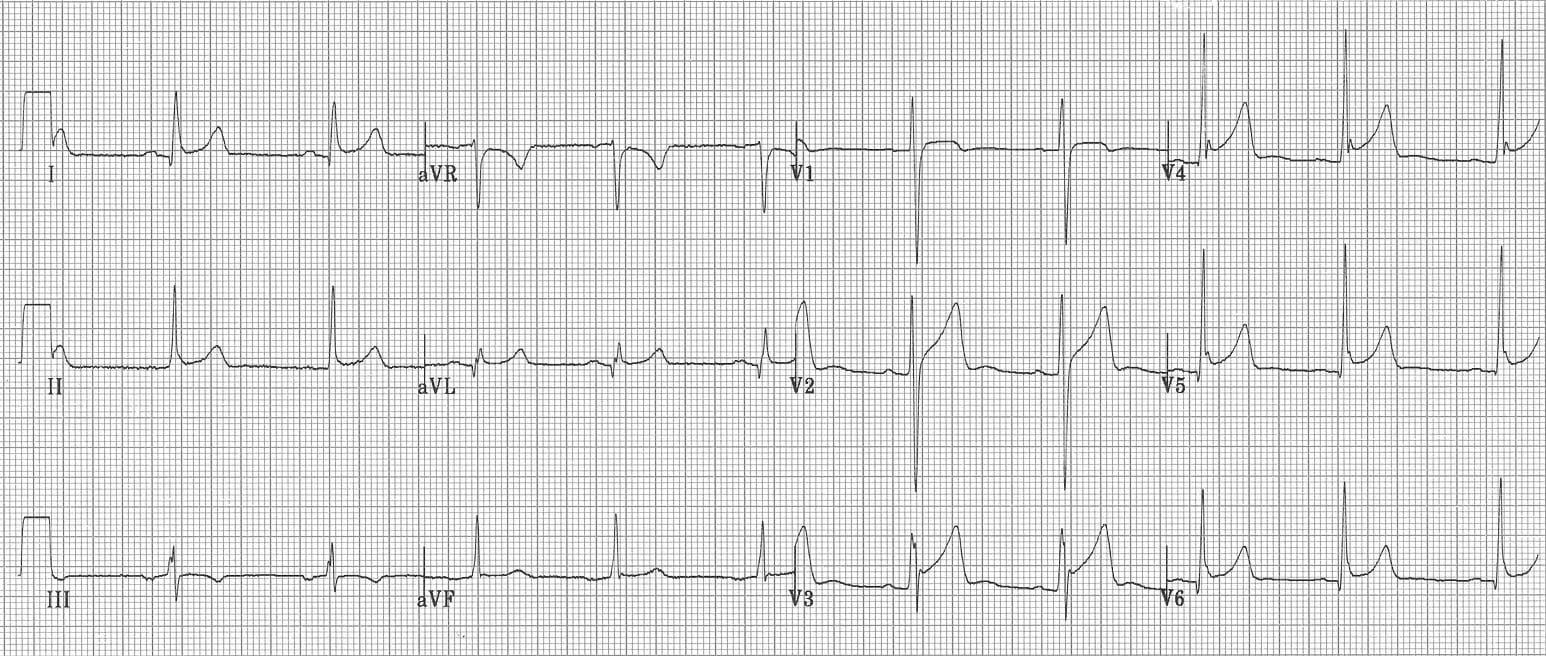
Pericarditis
Digoxin effect
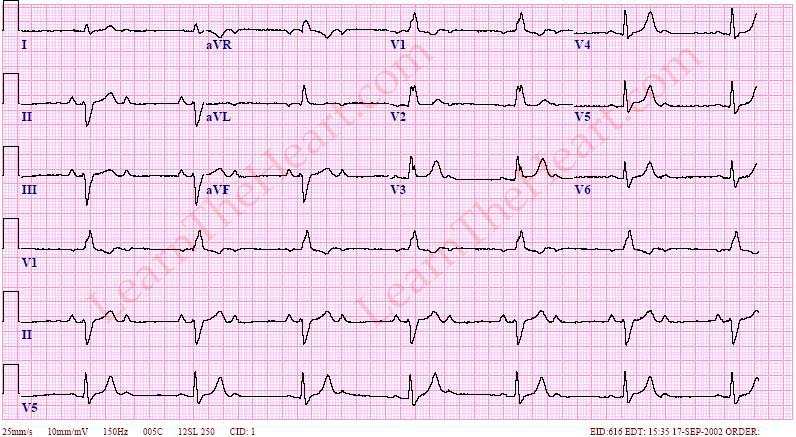
Left Ventricular Hypertrophy
Right Ventricular Hypertrophy